Invest Offshore Newsletter

Published: Tue, 04/30/19

Newsletter Issue #137 Invest Offshore


April 30, 2019
Offshore Investment Guide
Migration Of Millionaires/

Hi ,

There has been much new information related to the offshore, released and published in the month of April. The world of offshore banking and finance changes faster and faster, as the data becomes more transparent due foreign tax compliance, automatic exchange of tax information and common reporting standards.

In this issue we'll share a some of the best material, starting with an article submitted to Zero Hedge by Visual Capitalist.


Mapping The Global Migration Of Millionaires

High net worth individuals (HNWIs) – persons with wealth over US$1 million – may decide to pick up and move for a number of reasons. In some cases they are attracted by jurisdictions with more favorable tax laws, or less pollution and crime. Sometimes, they’re simply looking for a change of scenery.

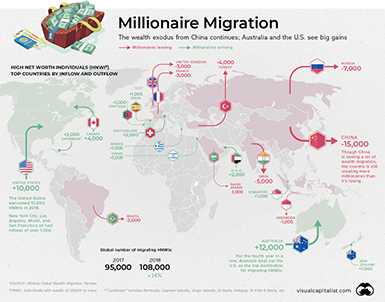
Today’s graphic, using data from the annual Global Wealth Migration Review, maps the migration of the world’s millionaires, and clearly shows which countries are magnets for the world’s rich, and which countries are seeing a wealth exodus.

The Flight of the Millionaires

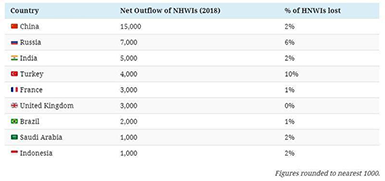
It’s no secret that China has been a wealth creation machine over the past two decades. Although the country is still making a number of its citizens very wealthy, over 15,000 Chinese HNWIs still chose to migrate to other countries in 2018 – the most significant migration of any country.

Here’s a look at the top countries by HNWI outflows:

The Flight of the Millionaires

Unlike the middle class, wealthy citizens have the means to pick up and leave when things start to sideways in their home country. An uptick in HNWI migration from a country can often be a signal of negative economic or societal factors influencing a country.

This is the case in Turkey, which has been rocked by instability, mass protests, and an inflation rate estimated to be in the triple-digits by some sources.

For the third straight year, Turkey lost more than 4,000 millionaires. An estimated 10% of Turkey’s HNWIs fled in 2018, which is concerning because unlike China and India, the country is not producing new millionaires in any significant number.

Millionaire Magnets

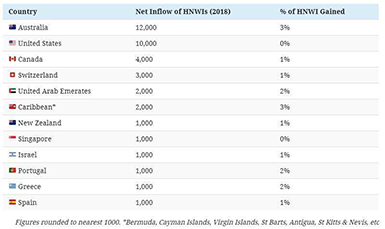
Time-honored locations – such as Switzerland and the Cayman Islands – continue to attract the world’s wealthy, but no country is experiencing HNWI inflows quite like Australia.

The Land Down Under has a number of attributes that make it an attractive destination for migrating millionaires. The country has a robust economy, and is perceived as being a safe place to raise a family. Even better, Australia has no inheritance tax and a lower cost of health care, which can make it an attractive alternative to the U.S.

In 2018, Australia jumped ahead of both Canada and France to become the seventh largest wealth market in the world.

Here’s a look at HNWI inflows around the world:

Millionaire Magnets

Greece, which was one of the worst performing wealth markets of the last decade, is finally seeing a modest inflow of millionaires again.

Submitted to Zero Hedge by Visual Capitalist.


Increase in Canadian Offshore Investment

According to data newly released by Statistics Canada, Canadian corporations held a staggering $353 billion in 12 of the world’s biggest tax haven destinations in 2018.

At the top of the list, Canadian corporations reported holding $90 billion in the tiny European nation of Luxembourg alone — that’s up $8.4 billion since 2017.

Luxembourg is followed by Barbados ($65 billion), Bermuda ($47 billion) and the Cayman Islands ($40 billion), Statistics Canada’s data on Canadian direct investment abroad reveals.

To put that sum of money into context, Luxembourg has now become Canada’s third top destination for corporate investments in the world, trailing only behind major G7 trading partners like the United States and the United Kingdom.

Barbados and Bermuda now round out the top five.

Increase in Canadian direct investment abroad driven by a weaker Canadian dollar

The stock of Canadian direct investment abroad increased by 10.4% in 2018 to reach $1,289 billion. On an instrument basis, almost all of the increase was due to higher equity positions (up $115 billion to $1,198 billion), with debt balances up $6 billion to $91 billion.

While the growth in the stock of Canadian direct investment abroad in 2018 was significantly higher than in the previous two years, the majority of that increase was due to valuation gains from a weaker Canadian dollar, which resulted in a $72 billion upward revaluation of Canada's direct investment position. In 2018, the Canadian dollar depreciated by 8.7% against the US dollar, 3.7% against the euro and 2.8% against the British pound.

On a regional basis, nearly three quarters of the 2018 increase in the stock of Canadian direct investment abroad was due to higher investment positions in the North America region, primarily the United States (up $70 billion to $595 billion). Most of the remaining increase was in Europe, led by higher investment in the United Kingdom (up $12 billion to $109 billion) and Luxembourg (up $8 billion to $90 billion).

Investment in other parts of the world was mixed, with an increase in the Asia/Oceania region (up $4 billion to $89 billion) offset in part by a small decline in South and Central America (down $1 billion to $67 billion). The increase in Asia/Oceania, primarily in China, Hong Kong and Japan, was due to a combination of valuation gains from the weaker Canadian dollar against most major Asian currencies and higher equity balances.

Changes in the value of currency also contributed to the lower investment positions in South and Central America, most notably in Argentina where a 53% decline in the value of the Argentinian peso against the Canadian dollar led to significant reduction in the investment position.

On an industry basis almost half of the growth in the stock of direct investment abroad in 2018 was in the finance and insurance industry (up $53 billion to $471 billion), with the transportation and warehousing as well as the management of companies and enterprises industries also showing significant increases. This growth was partially offset by declines in the information and cultural industries and in mining (except oil and gas).

The transportation and warehousing industry in particular has experienced a period of rapid growth in recent years, with the overall investment position increasing by nearly 150% from $34 billion in 2014 to $84 billion in 2018. This was largely driven by merger and acquisition activity in the United States.

Finance and insurance (37%) continued to be the most significant industry for Canadian direct investment abroad in 2018, followed by mining and oil and gas extraction (15%) and management of companies and enterprises (13%).

Source: Stats Canada Foreign direct investment, 2018

Offshore Investment into Canada

Pickup in merger and acquisition activity helps to push foreign direct investment in Canada higher

The stock of foreign direct investment in Canada rose by 5.0% in 2018 to $877 billion. The increase was the largest in four years and was the result of higher equity positions (up $44 billion to $732 billion), moderated by lower debt instrument positions (down $2 billion to $145 billion). The increase in the equity position was stimulated by a pickup in merger and acquisition activity following a net decline in this activity in 2017.

The North America region posted the largest increase in investment positions, up $22 billion to $438 billion, followed by Europe with a $15 billion rise to $329 billion. On a country basis, the United States accounted for nearly half of the overall increase in 2018, up $19 billion to $406 billion, followed by the Netherlands (up $5 billion to $107 billion) and the United Kingdom (up $3 billion to $50 billion).

On an industry basis, the growth in foreign direct investment in Canada was widespread, with manufacturing (up $17 billion to 202 billion) accounting for the largest increase. The increase in manufacturing was mostly concentrated in chemical and food manufacturing. The next largest increases were in the wholesale trade and in the agriculture, forestry, fishing and hunting industries. This growth was partially offset by a decline in retail trade.

The growth in agriculture, forestry, fishing and hunting was uncharacteristically high, increasing from $182 million in 2017 to $4.7 billion in 2018. This was largely driven by merger and acquisition activity from the United States.

Manufacturing (23%) continued to be the most significant industry for foreign direct investment in Canada in 2018, followed by mining and oil and gas extraction (20%) and management of companies and enterprises (20%).

Source: Stats Canada Foreign direct investment, 2018
Invest Offshore


SITE INDEX
Home
Invest Offshore

Blog
Daily Blog

Services
Services

Contact
Contact Us
POPULAR ARTICLES
19/3/19
Legal and tax compliant NQDC personal investment structure

24/2/18
CRS Compliant ICO Operational Trading Platform

23/2/18
BitCoin, The New World Currency or A Passing Fad

15/2/18
BitCoin Tax Implications and the CRA (Revenue Canada)

9/2/18
New York Fed’s Money and Payment Studies on Cryptocurrency

SOCIAL NETWORKS

LinkedIn

OffshoreMaven on Twitter

Invest Offshore on Facebook

Invest Offshore on YouTube


Invest Offshore homeAbout us

Disclaimer: This document was produced by and the opinions expressed are those of Invest Offshore as of the date of writing and are subject to change. It has been prepared solely for information purposes and for the use of the recipient. It does not constitute an offer or an invitation by or on behalf of Invest Offshore to any person to buy or sell any security. Any reference to past performance is not necessarily a guide to the future. The information and analysis contained in this publication have been compiled or arrived at from sources believed to be reliable but Invest Offshore does not make any representation as to their accuracy or completeness and does not accept liability for any loss arising from the use hereof.

Home   |  About   |  Contact   |  Privacy Unsubscribe from this Newsletter